tomcat 日志收集
Tomcat 跨行错误日志 -> ES
tomcat 运行会在
catalina.out / catalina.YYYY-mm-DD.log上生成大量的启动日志
这些启动日志与其他日志相比具有跨行的特性,采集它们需要用到特殊pattern匹配
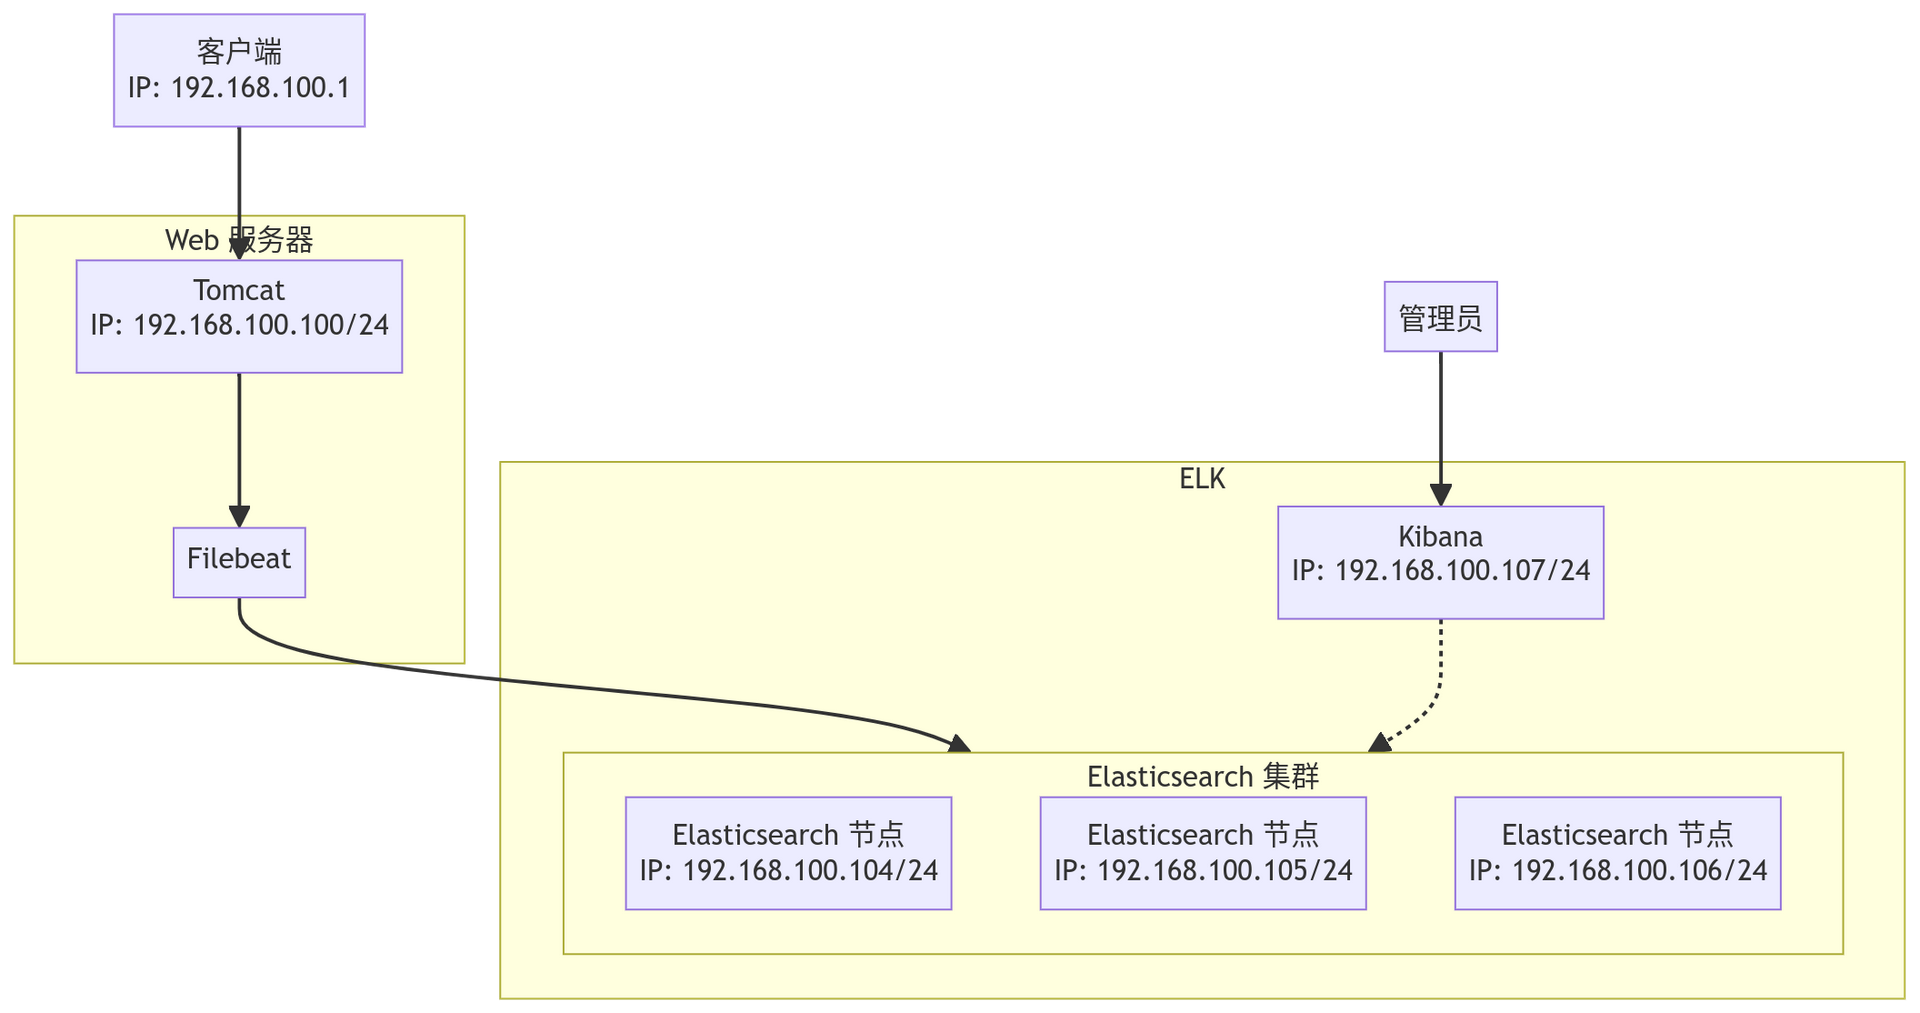
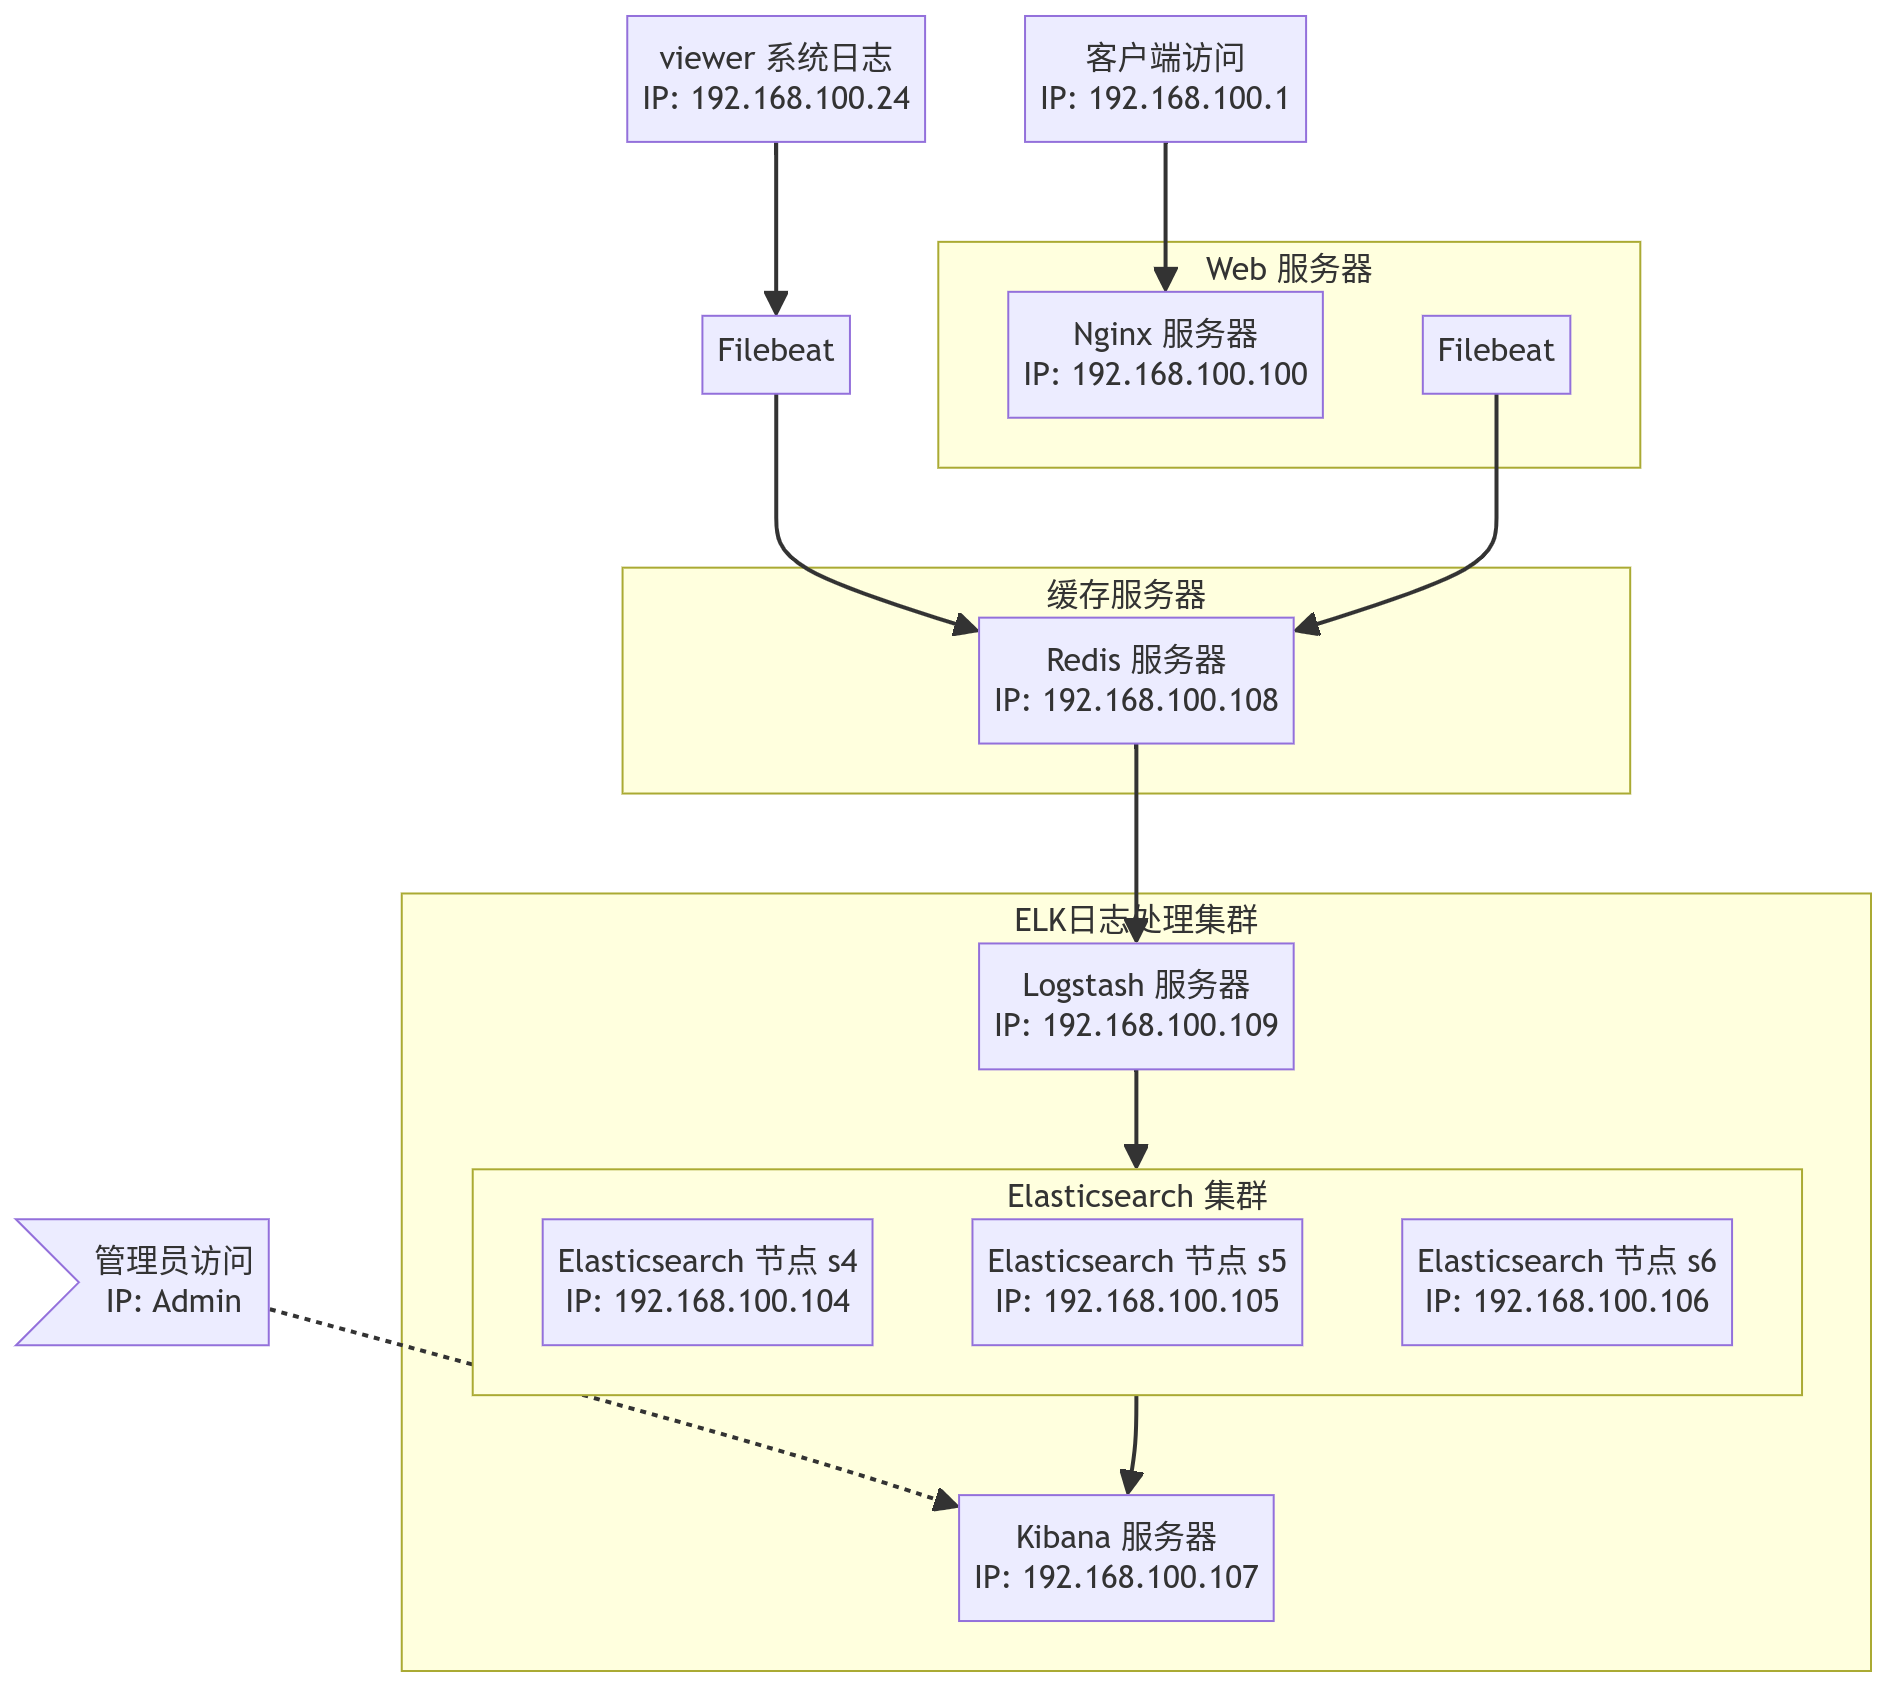
拓扑图
修改配置
安装tomcat
dnf install tomcat9 tomcat-*
> Package tomcat-admin-webapps-1:9.0.62-30.el8.noarch
> Package tomcat-docs-webapp-1:9.0.62-30.el8.noarch
> Package tomcat-webapps-9.0.62-30.el8.noarch.rpm
filebeat配置
# /etc/filebeat/tomcat-catalina.yml
filebeat.inputs:
- type: log
enabled: true
paths:
- /var/log/tomcat/catalina.*.log
tags: ["tomcat-catalina-log"]
processors:
- dissect:
tokenizer: '%{date} %{time} %{catalina.warnLevel} [%{catalina.method}] %{catalina.class} %{catalina.logMessage}'
field: "message"
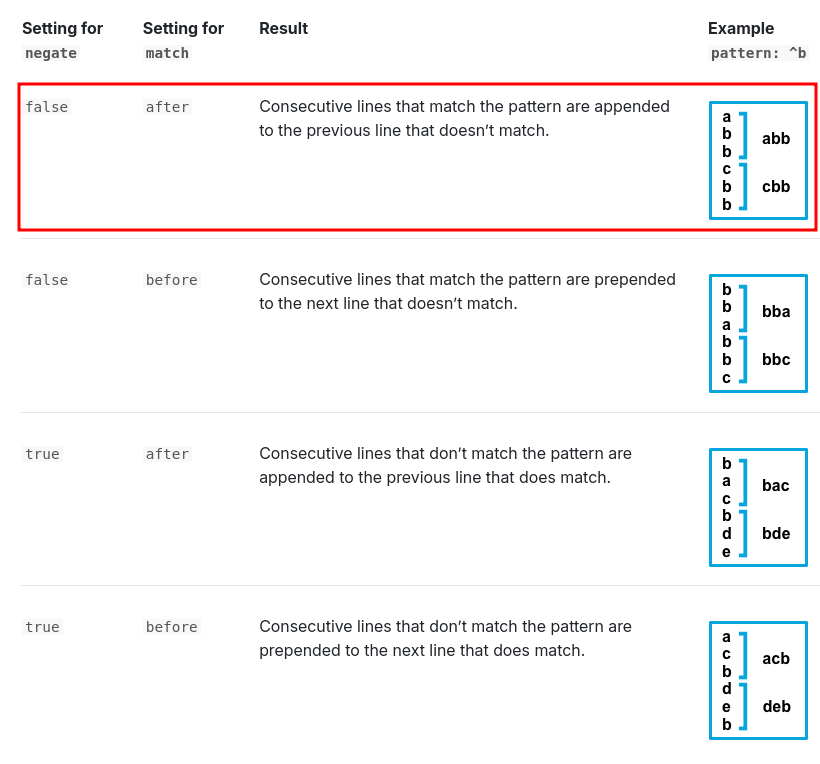
multiline.type: pattern
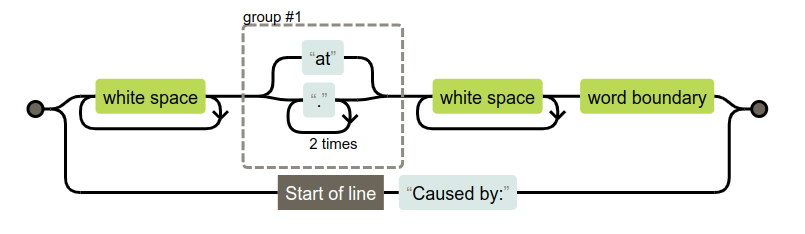
multiline.pattern: '^[[:space:]]+(at|\.{3})[[:space:]]+\b|^Caused by:'
multiline.negate: false
multiline.match: after
output.elasticsearch:
hosts: ["192.168.100.104:9200","192.168.100.105:9200","192.168.100.106:9200"]
indices:
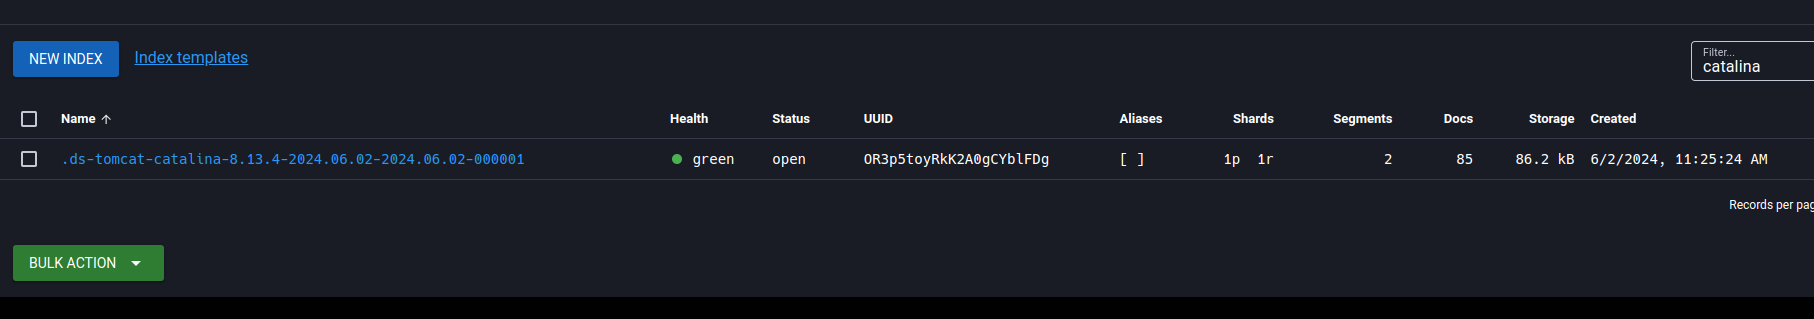
- index: "tomcat-catalina-%{[agent.version]}-%{+yyy.MM.dd}"
when.contains:
tags: "tomcat-catalina-log"
setup.ilm.enabled: false
setup.template.name: "tomcat-catalina"
setup.template.pattern: "tomcat-catalina-*"- 正则表达图解
验证配置
# 验证配置文件
filebeat test config -c /etc/filebeat/tomcat-catalina.yml

# 启动服务
filebeat -e -c /etc/filebeat/tomcat-catalina.yml
GUI查看
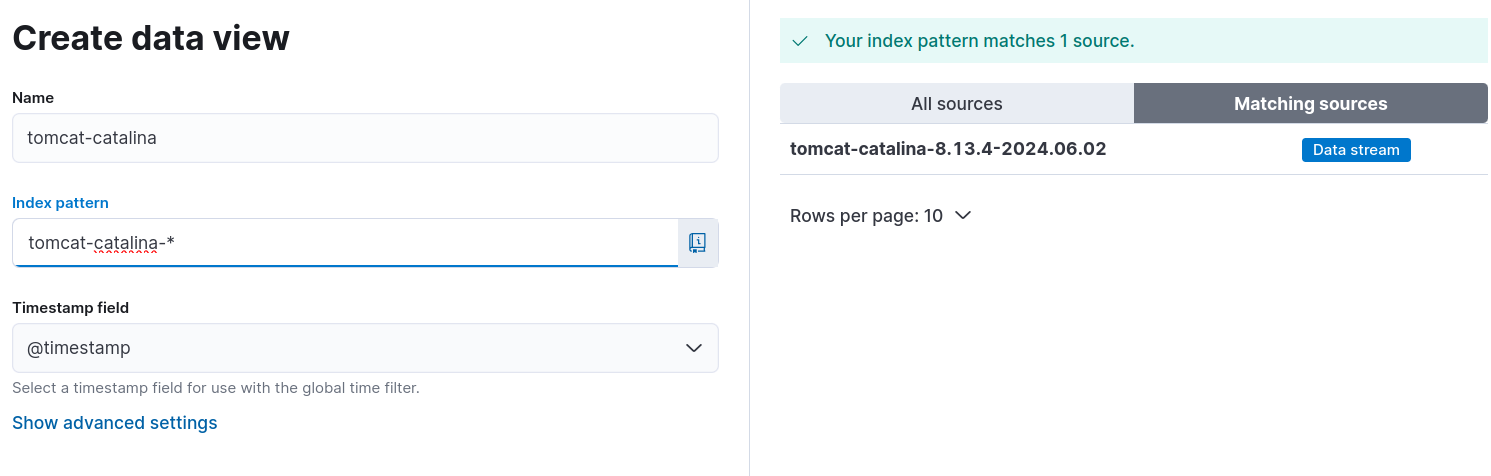
Kibana查看
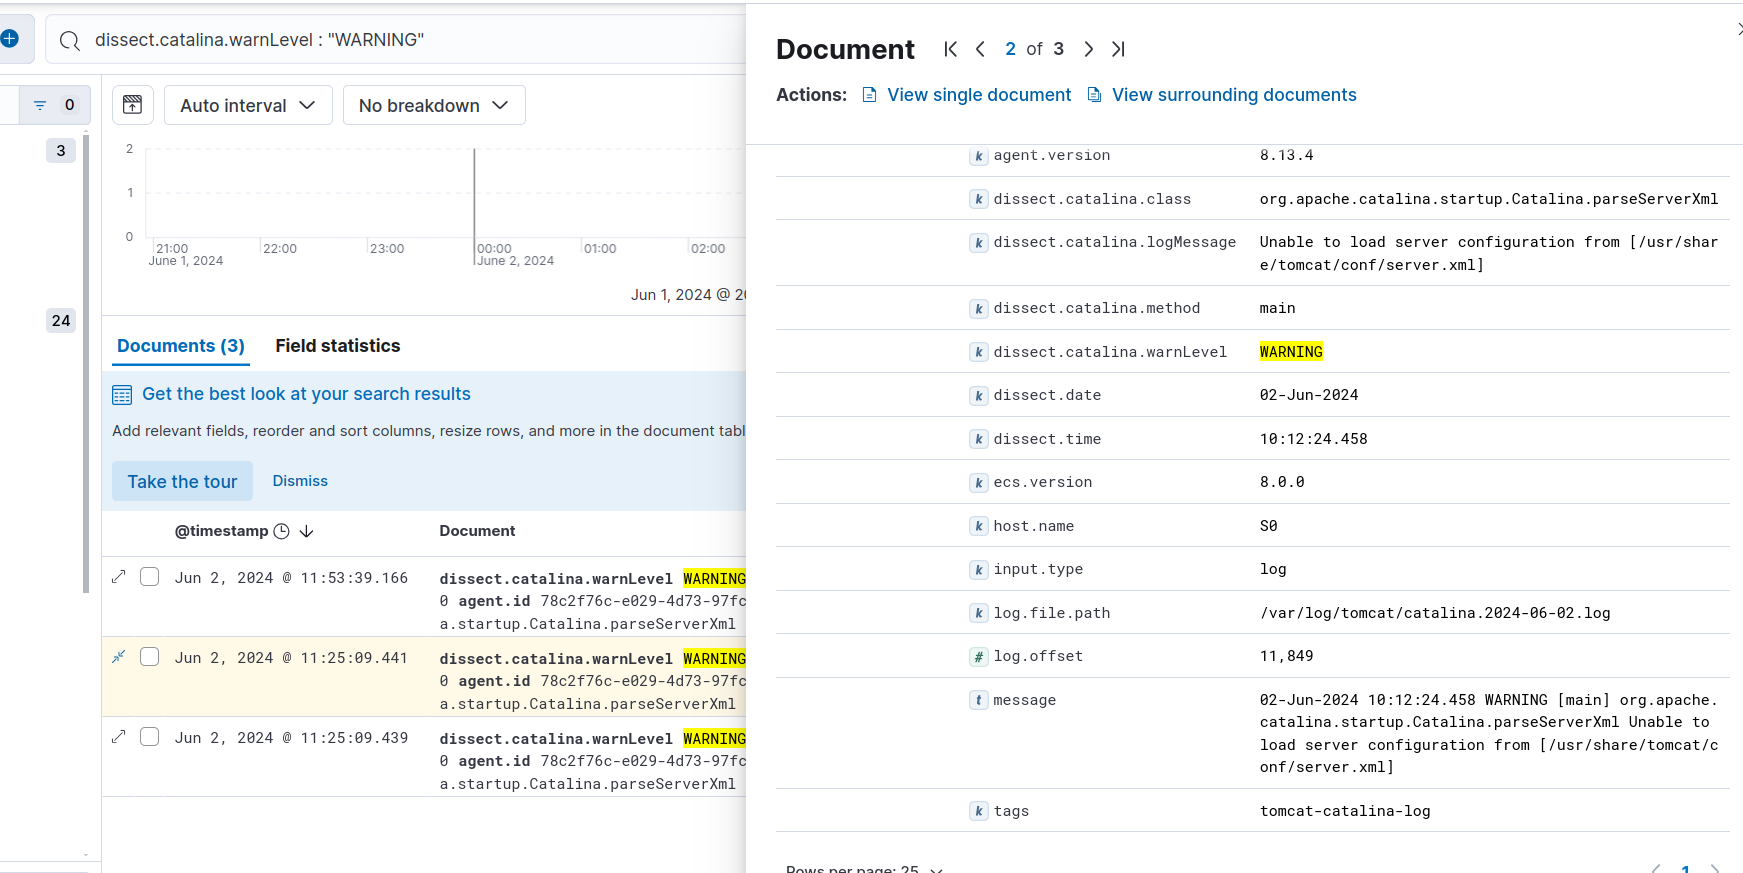
通过字段解析获得查能力
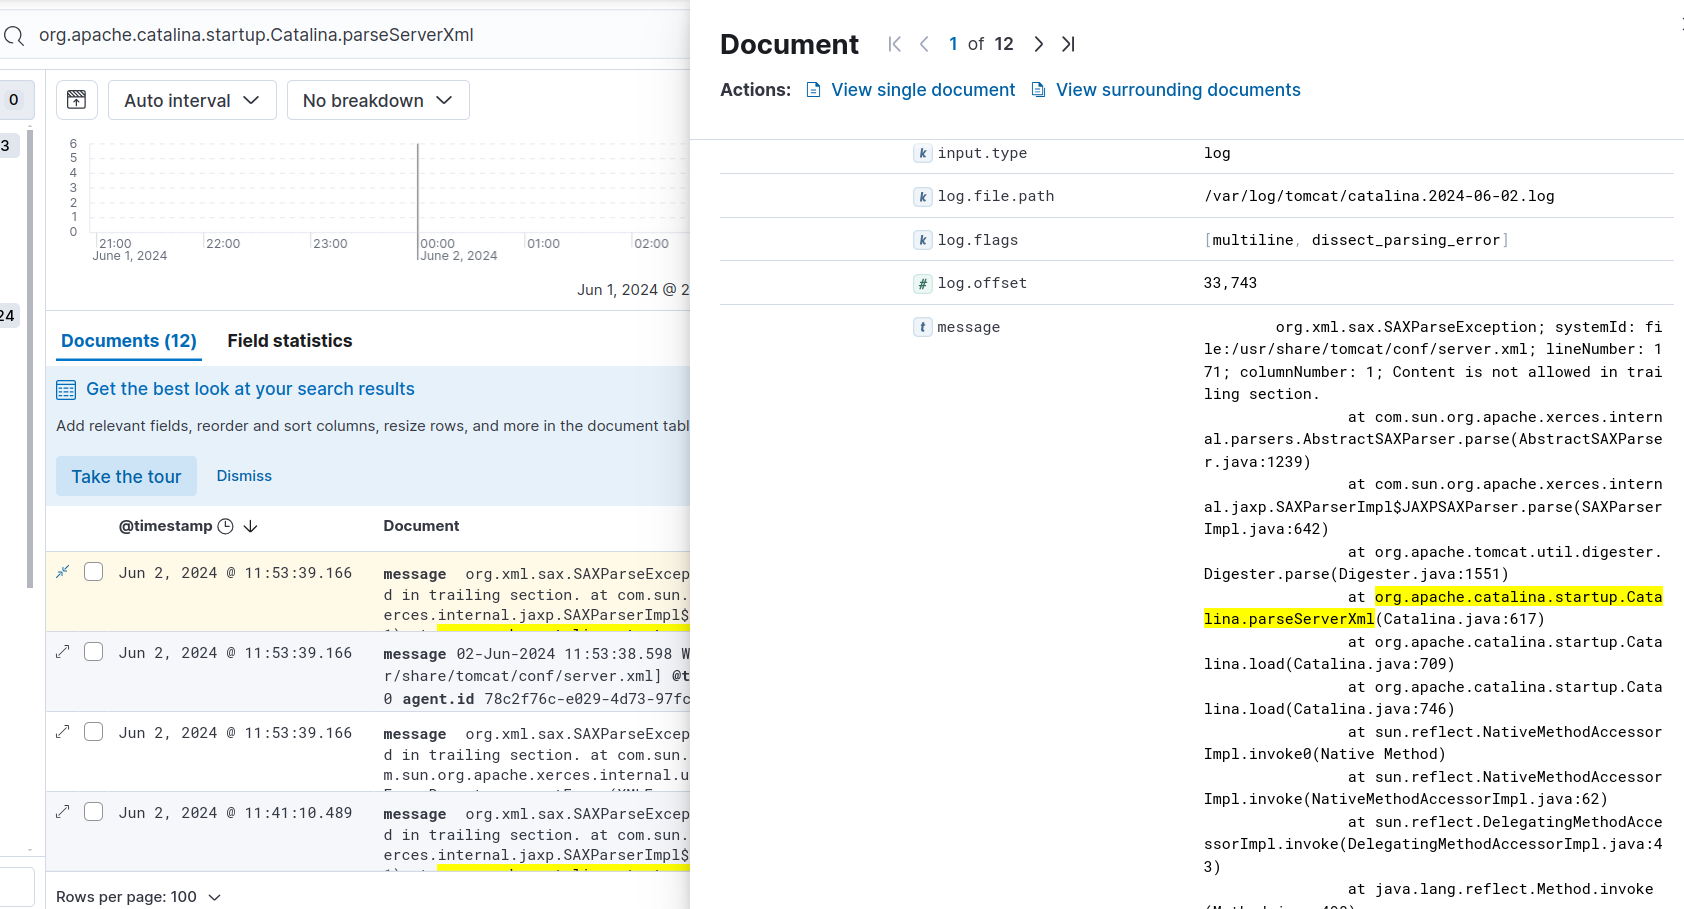
通过全文查询获得合并日志
nginx、syslog 日志收集
架构信息
架构图
架构表
| 编号 | 主机名 | OS | IP | 功能 | 安装工具 | 服务端口 |
|---|---|---|---|---|---|---|
| 1 | viewer | Ubuntu22.04.1 LTS (Jammy Jellyfish) | 192.168.100.24 | 客户端访问 系统日志收集 |
curl Filebeat 8.13.4 |
NA |
| 2 | s0 | Rocky8.7 (Green Obsidian) | 192.168.100.100 | Nginx 服务器 Filebeat Nginx日志收集 |
nginx 1.14.1 Filebeat 8.13.4 |
http:80 |
| 3 | s4 | Rocky8.7 (Green Obsidian) | 192.168.100.104 | Elastic 服务器 | elastic 8.13.4 | http:9200, tcp:9300 |
| 4 | s5 | Rocky8.7 (Green Obsidian) | 192.168.100.105 | Elastic 服务器 | elastic 8.13.4 | http:9200, tcp:9300 |
| 5 | s6 | Rocky8.7 (Green Obsidian) | 192.168.100.106 | Elastic 服务器 | elastic 8.13.4 | http:9200, tcp:9300 |
| 6 | s7 | Rocky8.7 (Green Obsidian) | 192.168.100.107 | kibana 服务器 | kibana 8.13.4 | http:5601 |
| 7 | s8 | Rocky8.7 (Green Obsidian) | 192.168.100.108 | redis 服务器 | redis 5.0.3 | tcp: 6379 |
| 8 | s9 | Rocky8.7 (Green Obsidian) | 192.168.100.109 | Logstash 服务器 | Logstash 8.13.4 | NA |
Nginx 安装配置
# 安装服务
dnf install nginx

# 修改日志为JSON格式
log_format access_json '{"@timestamp":"$time_iso8601",'
                       '"host":"$server_addr",'
                       '"clientip":"$remote_addr",'
                       '"size":$body_bytes_sent,'
                       '"responsetime":$request_time,'
                       '"upstreamtime":"$upstream_response_time",'
                       '"upstreamhost":"$upstream_addr",'
                       '"http_host":"$host",'
                       '"uri":"$uri",'
                       '"domain":"$host",'
                       '"xff":"$http_x_forwarded_for",'
                       '"referer":"$http_referer",'
                       '"tcp_xff":"$proxy_protocol_addr",'
                       '"http_user_agent":"$http_user_agent",'
                       '"status":"$status"}';
access_log  /var/log/nginx/access.log  access_json;

# 启动服务
systemctl start nginx.service
Redis 安装配置
# 安装redis
dnf install redis

# 配置redis
# 修改其监听所有地址及修改登录密码为 alfiecheung
sed -i.bak -e 's/^bind.*/bind 0.0.0.0/' \
-e "s/# requirepass foobared.*/requirepass alfiecheung/g" \
/etc/redis.conf

# 启动rredis
systemctl start redis.service
Elastic search 集群部署配置
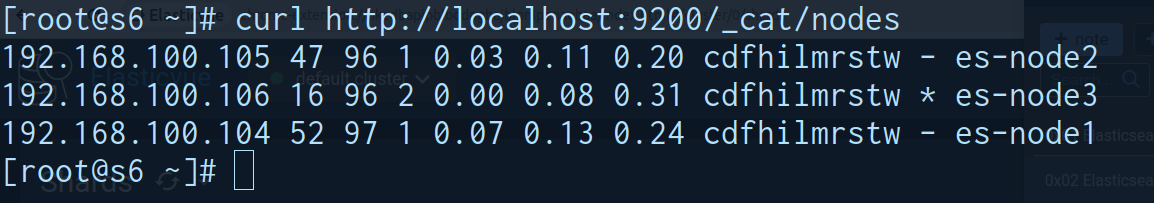
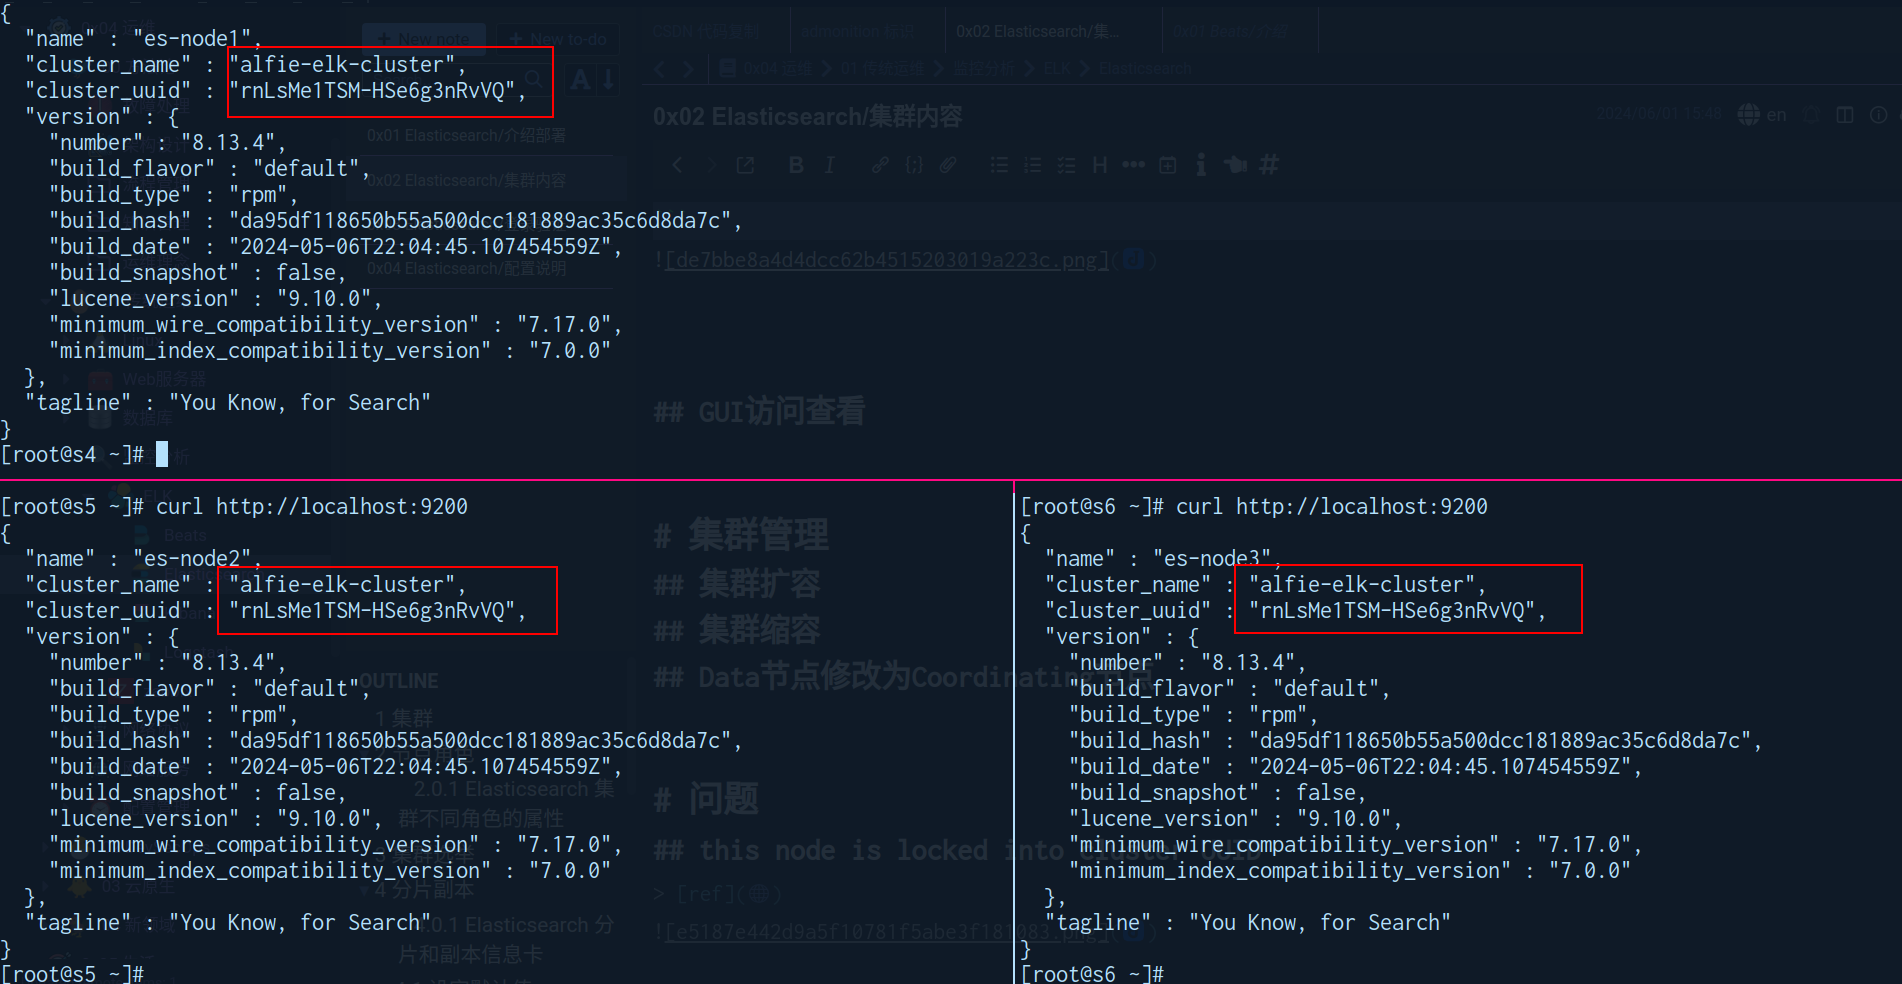
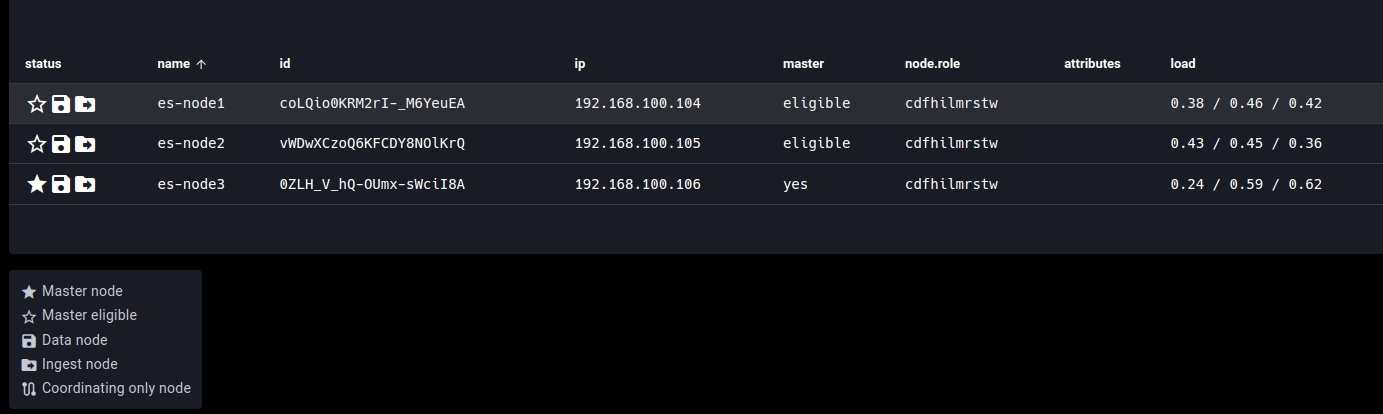
节点拓扑
| 节点 | 角色 | IP |
|---|---|---|
| s4 | eligible | 192.168.100.104 |
| s5 | eligible | 192.168.100.105 |
| s6 | Master | 192.168.100.106 |
安装软件
wget https://mirrors.tuna.tsinghua.edu.cn/elasticstack/8.x/yum/8.13.4/elasticsearch-8.13.4-x86_64.rpm

rpm -ivh elasticsearch-8.13.4-x86_64.rpm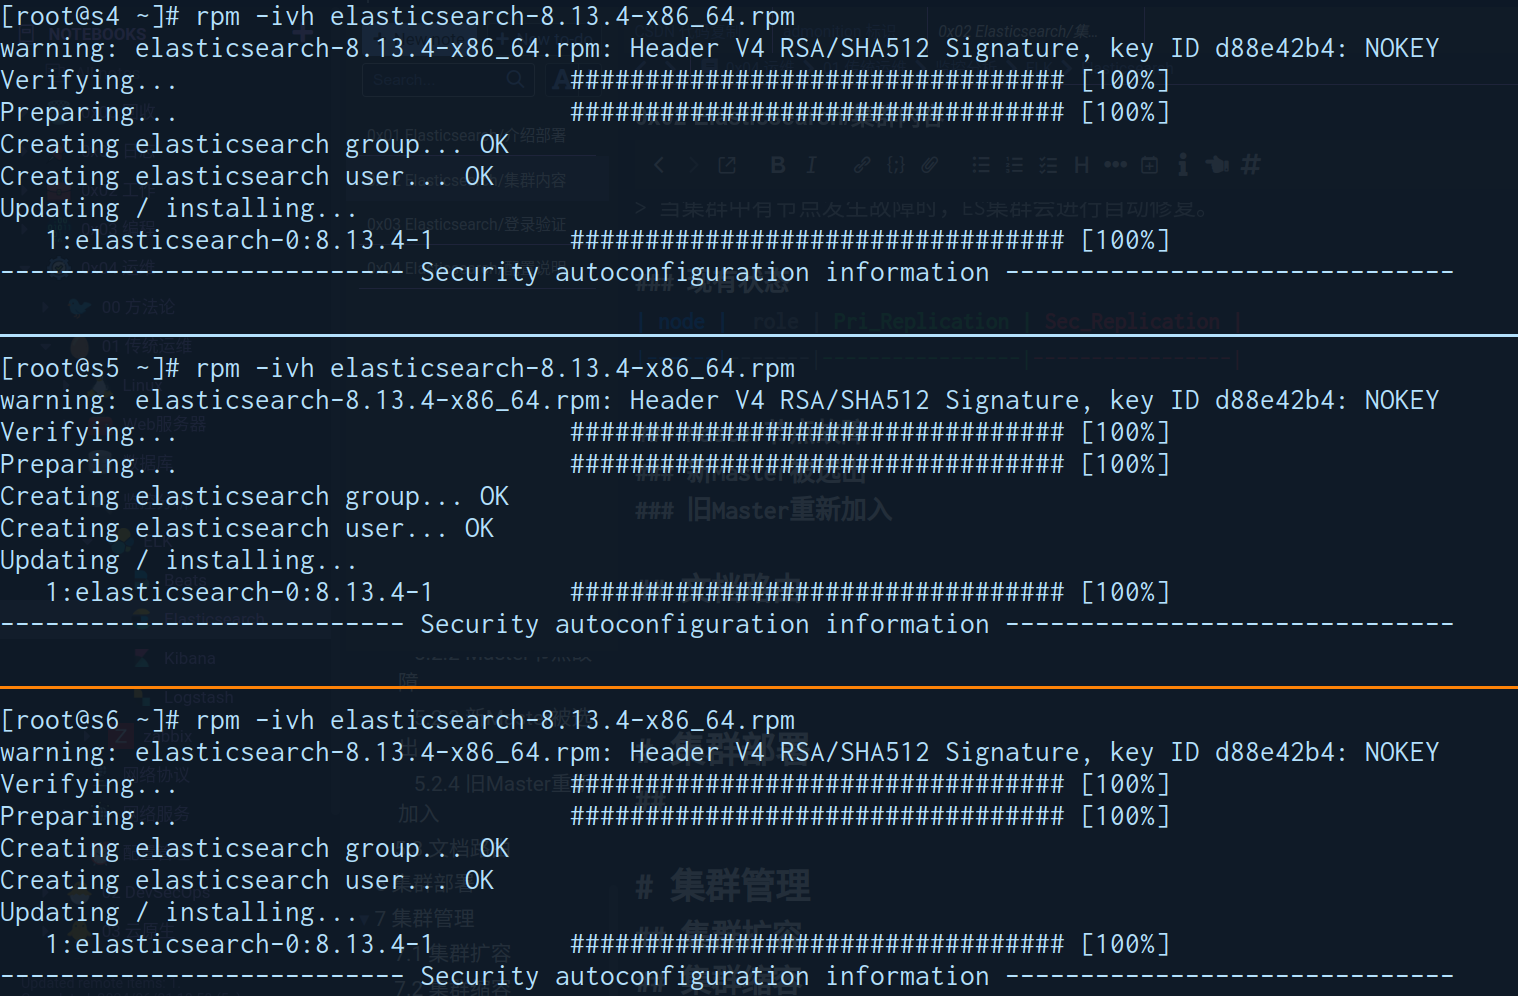
配置
# /etc/elasticsearch/jvm.options
-Xms1G
-Xmx1G

# /etc/security/limits.conf
elasticsearch  soft  memlock  unlimited
elasticsearch  hard  memlock  unlimited

# /usr/lib/systemd/system/elasticsearch.service
[Service]
LimitMEMLOCK=infinity

# /etc/elasticsearch/elasticsearch.yml
# 每部主机唯一
node.name: es-node1
# 同集群使用同一个名称
cluster.name: alfie-elk-cluster
# 准备进行选举的主机都添加于此或直接指定master
# cluster.initial_master_nodes: ["192.168.100.104"]
discovery.seed_hosts: ["192.168.100.104","192.168.100.105","192.168.100.106"]
# 集群监听端口对应的IP,默认是127.0.0.1:9300
network.host: 0.0.0.0
# es服务监听地址,默认端口 9200
http.host: 0.0.0.0

path.data: /var/lib/elasticsearch
path.logs: /var/log/elasticsearch

# 如果不关闭 xpack.security.enabled, 则需要按照如何方式访问
# 开启后需要使用https访问 (curl -k -u elastic:PWD https://localhost:9200)
# 密码来自安装软件首次自动生成的信息 (如下所示)
# The generated password for the elastic built-in superuser is : w4yD7JEths_3e8pUbIqt
xpack.security.enabled: false
xpack.security.enrollment.enabled: true
xpack.security.http.ssl:
  enabled: true
  keystore.path: certs/http.p12
xpack.security.transport.ssl:
  enabled: true
  verification_mode: certificate
  keystore.path: certs/transport.p12
  truststore.path: certs/transport.p12

# 内存优化配合上述 limits.conf 和  elasticsearch.service 配合修改生效
bootstrap.memory_lock: true
开启服务
systemctl daemon-reload
systemctl start elasticsearch.service

# 检查日志
tail -f /var/log/elasticsearch

# 访问测试
curl -k -u elastic:PWD https://localhost:9200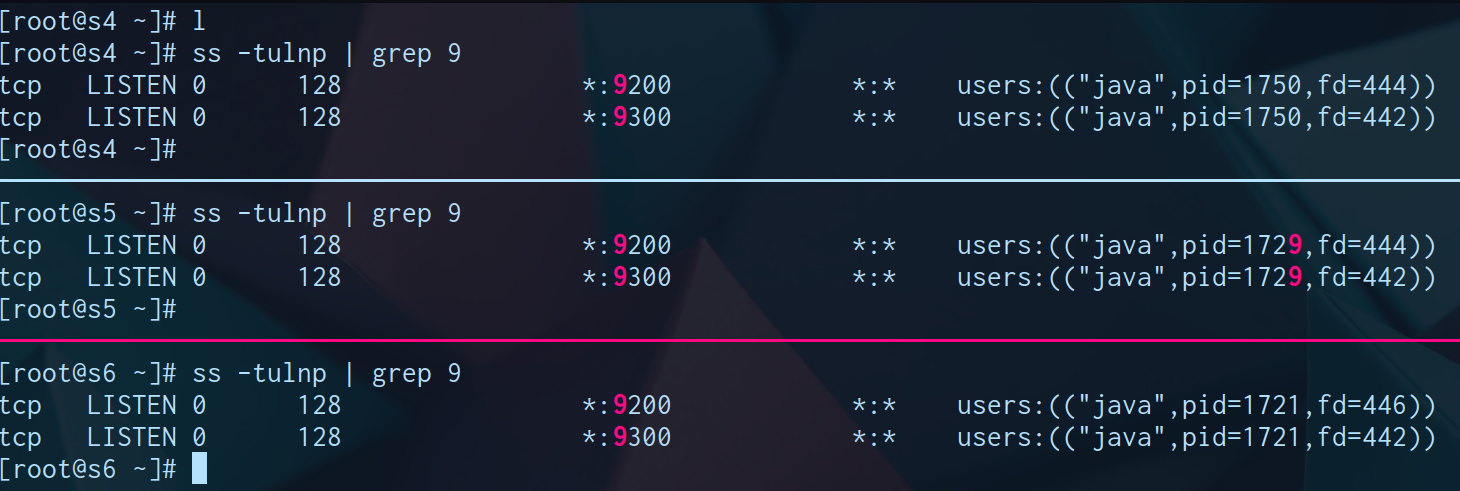
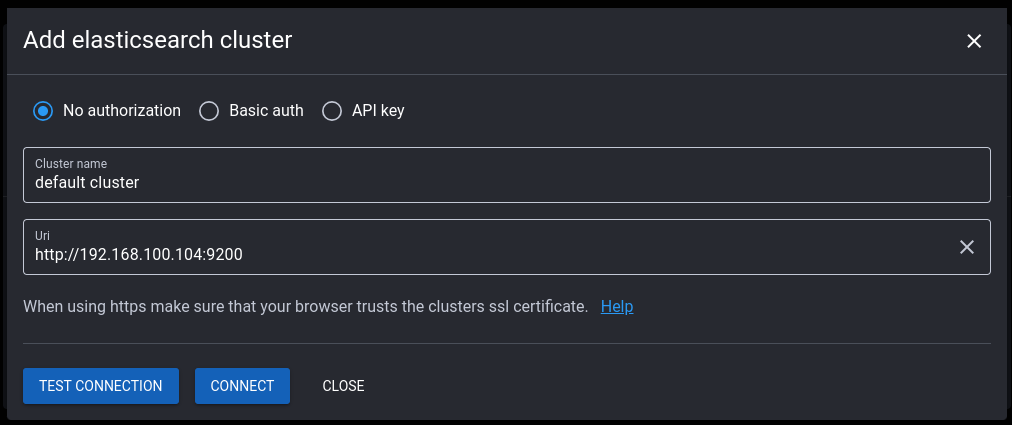
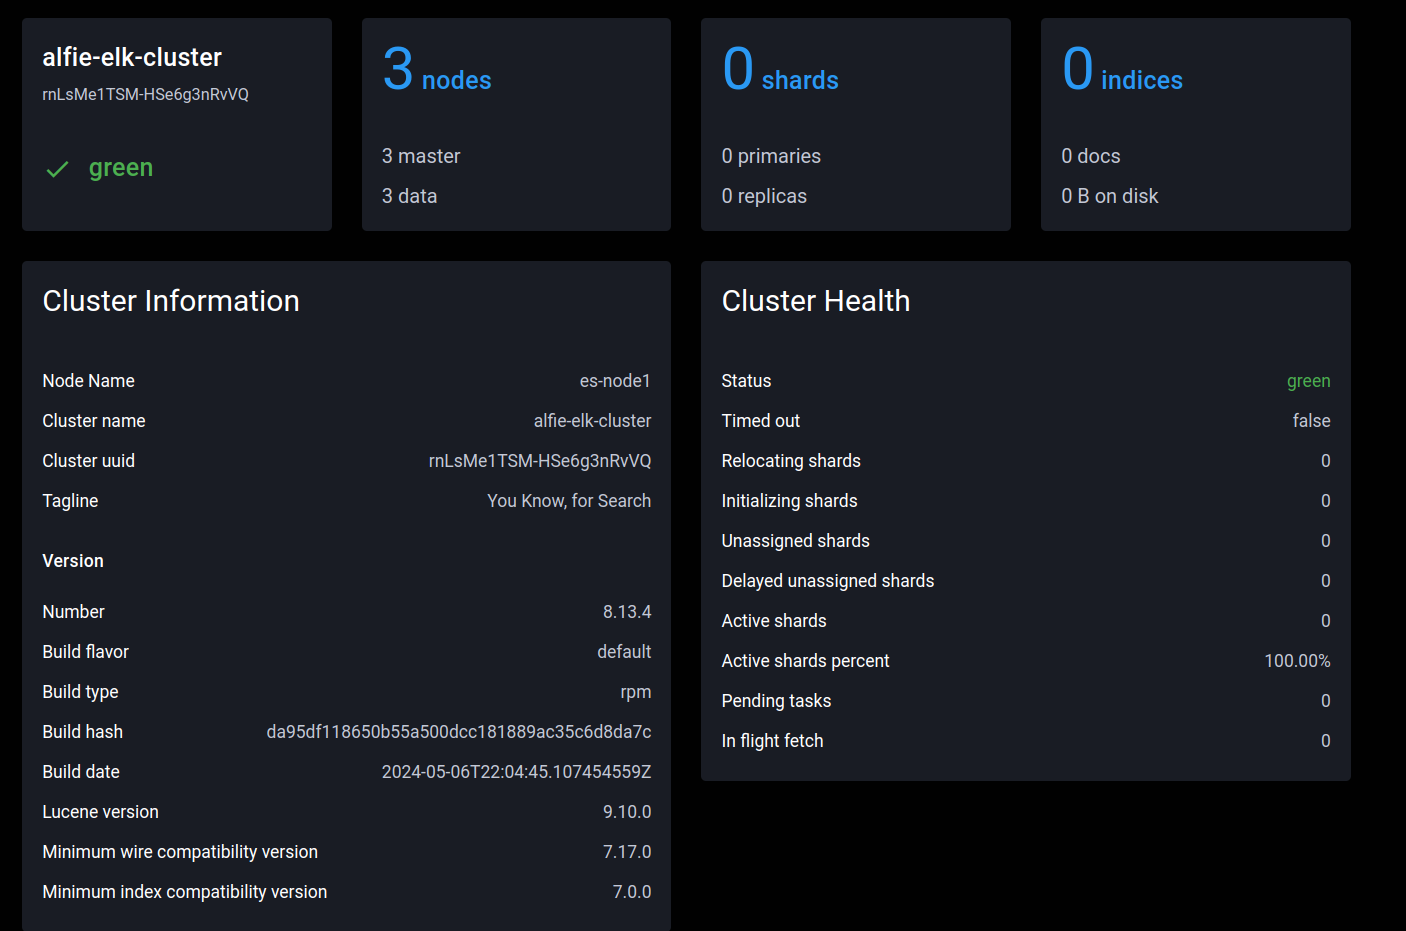
elasticvue访问查看
Kibana 安装配置
应用安装
# 下载包
    # 官网:https://www.elastic.co/cn/downloads/elasticsearch
    # deb包
    wget https://mirrors.tuna.tsinghua.edu.cn/elasticstack/8.x/apt/pool/main/k/kibana/kibana-8.13.4-amd64.deb

    # rpm包
    wget https://mirrors.tuna.tsinghua.edu.cn/elasticstack/8.x/yum/8.13.4/kibana-8.13.4-x86_64.rpm

# 安装包
    dpkg -i kibana-8.13.4-amd64.deb
    rpm -ivh kibana-8.13.4-x86_64.rpm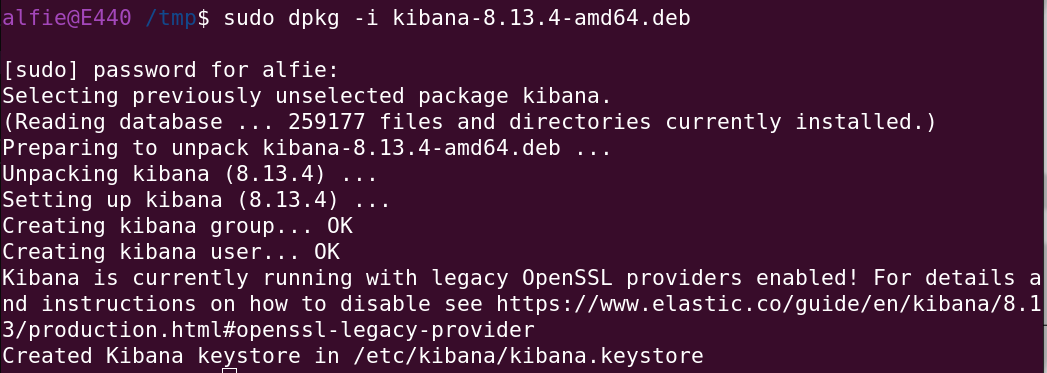
配置修改
> 文件路径:/etc/kibana/kibana.yml

# 监听端口,此为默认值
server.port: 5601

# 修改此行的监听地址,默认为localhost,即:127.0.0.1:5601
server.host: "0.0.0.0"

# 修改此行,指向ES任意服务器地址或多个节点地址实现容错,默认为localhost
elasticsearch.hosts: ["http://10.0.0.101:9200","http://10.0.0.102:9200","http://10.0.0.103:9200"]

# 语言支持,默认为英文可以修改为中文(zh-CN)
i18n.locale: "en"

# 设置 Kibana 对外提供服务时的基础 URL,往往设定为反向代理
server.publicBaseUrl: "http://kibana-rerver-server.com"
启动服务
systemctl daemon-reload
systemctl start kibana.service
访问
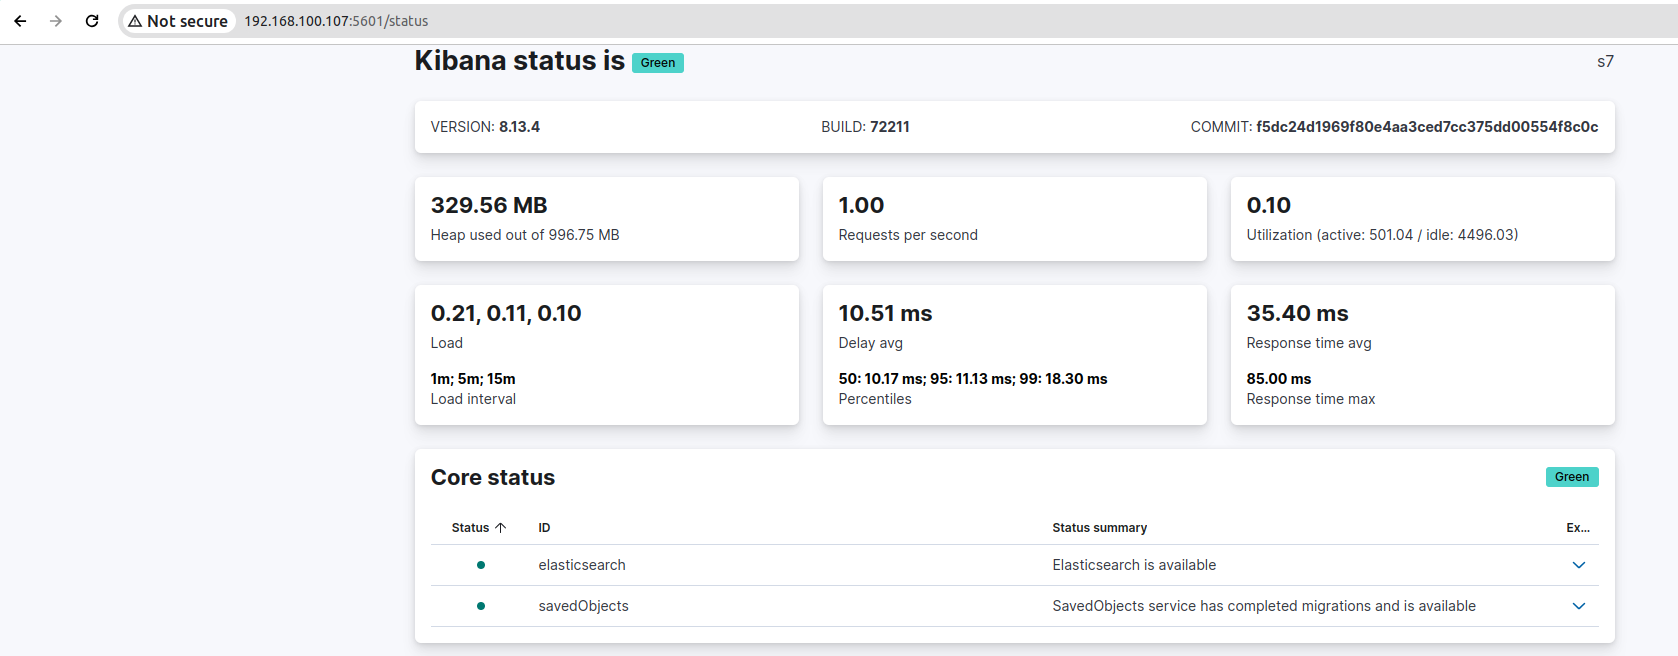
登录查看

状态查看
Filebeat 安装配置
nginx
wget https://mirrors.tuna.tsinghua.edu.cn/elasticstack/8.x/yum/8.13.4/filebeat-8.13.4-x86_64.rpm
rpm -ivh filebeat-8.13.4-x86_64.rpm
# /etc/filebeat/filebeat.yml
# 测试不能使用tag区分创建连个key,使用filed注入可以
filebeat.inputs:
- type: filestream
id: nginx-access-id
enabled: true
paths:
- /var/log/nginx/access.log
parsers:
- ndjson:
keys_under_root: true
overwrite_keys: true
add_error_key: true
fields:
log_type: "access"
fields_under_root: false
# 旧log格式
# https://www.elastic.co/guide/en/beats/filebeat/current/filebeat-input-filestream.html
# inputs.log deprecated in 7.16.0 (但是仍然可生效)
#filebeat.inputs:
#- type: log
# #id: nginx-access-id
# enabled: true
# paths:
# - /var/log/nginx/access.log
# json.keys_under_root: true
# json.overwrite_keys: true
# fields:
# log_type: "access"
- type: filestream
id: nginx-error-id
enabled: true
paths:
- /var/log/nginx/error.log
fields:
log_type: "error"
output.redis:
hosts: ["192.168.100.108:6379"]
password: "alfiecheung"
db: 0
timeout: 5
key: "nginx-log"
keys:
- key: "filebeat_nginx_access"
when.equals:
fields.log_type: "access"
- key: "filebeat_nginx_error"
when.equals:
fields.log_type: "error"syslog
wget https://mirrors.tuna.tsinghua.edu.cn/elasticstack/8.x/apt/pool/main/f/filebeat/filebeat-8.13.4-amd64.deb
dpkg -i filebeat-8.13.4-amd64.deb
filebeat.inputs:
- type: log
enabled: true
paths:
- /var/log/syslog
tags: ["syslog"]
output.redis:
hosts: ["192.168.100.108:6379"]
key: "syslog-log"
password: "alfiecheung"
db: 0
timeout: 5检查启动
# 配置检查
filebeat test config -c /etc/filebeat/filebeat.yml

# 启动服务
systemctl start filebeat.service
Logstash 安装配置
安装
wget https://mirrors.tuna.tsinghua.edu.cn/elasticstack/8.x/yum/8.13.4/logstash-8.13.4-x86_64.rpm

rpm -ivh logstash-8.13.4-x86_64.rpm
配置
# /etc/logstash/logstash.yml
path.data: /var/lib/logstash
path.logs: /var/log/logstash

# /etc/logstash/conf.d/syslog.yml
input {
  redis {
    host => "192.168.100.108"
    port => 6379
    db => 0
    password => "alfiecheung"
    key => "syslog-log"
    data_type => "list"
  }
}

filter {
  grok {
    match => { "message" => "%{SYSLOGTIMESTAMP:syslog_timestamp} %{GREEDYDATA:syslog_message}" }
  }

  date {
    match => [ "syslog_timestamp", "MMM  d HH:mm:ss", "MMM dd HH:mm:ss" ]
    timezone => "UTC"
    target => "@timestamp"
  }

  mutate {
    add_field => { "utc_plus_8" => "%{@timestamp}" }
  }

  date {
    match => [ "utc_plus_8", "ISO8601" ]
    timezone => "Asia/Shanghai"
    target => "utc_plus_8"
  }
}

output {
  elasticsearch {
    hosts => ["192.168.100.104:9200","192.168.100.105:9200","192.168.100.106:9200"]
    index => "syslog-%{+YYYY.MM.dd}"
  }
  stdout {
    codec => rubydebug
  }
}

# /etc/logstash/conf.d/nginx.yml
input {
  redis {
    host => "192.168.100.108"
    port => 6379
    password => "alfiecheung"
    db => 0
    key => "filebeat_nginx_access"
    data_type => "list"
    add_field => { "log_type" => "nginx-access" }
  }
  redis {
    host => "192.168.100.108"
    port => 6379
    password => "alfiecheung"
    db => 0
    key => "filebeat_nginx_error"
    data_type => "list"
    add_field => { "log_type" => "nginx-error" }
  }
}

output {
  if [log_type] == "nginx-access" {
    elasticsearch {
      hosts => ["192.168.100.104:9200", "192.168.100.105:9200", "192.168.100.106:9200"]
      index => "web-access-logs%{+YYYY.MM.dd}"
      template_overwrite => true
      # 新增
      manage_template => false
      ilm_enabled => false
      # 新增
    }
  } else if [log_type] == "nginx-error" {
    elasticsearch {
      hosts => ["192.168.100.104:9200", "192.168.100.105:9200", "192.168.100.106:9200"]
      index => "web-error-logs%{+YYYY.MM.dd}"
      template_overwrite => true
      # 新增
      manage_template => false
      ilm_enabled => false
      # 新增
    }
  }
}
!!! info 配置检查
/usr/share/logstash/bin/logstash -f /etc/logstash/conf.d/my-logstash.conf -t!!!
验证查看
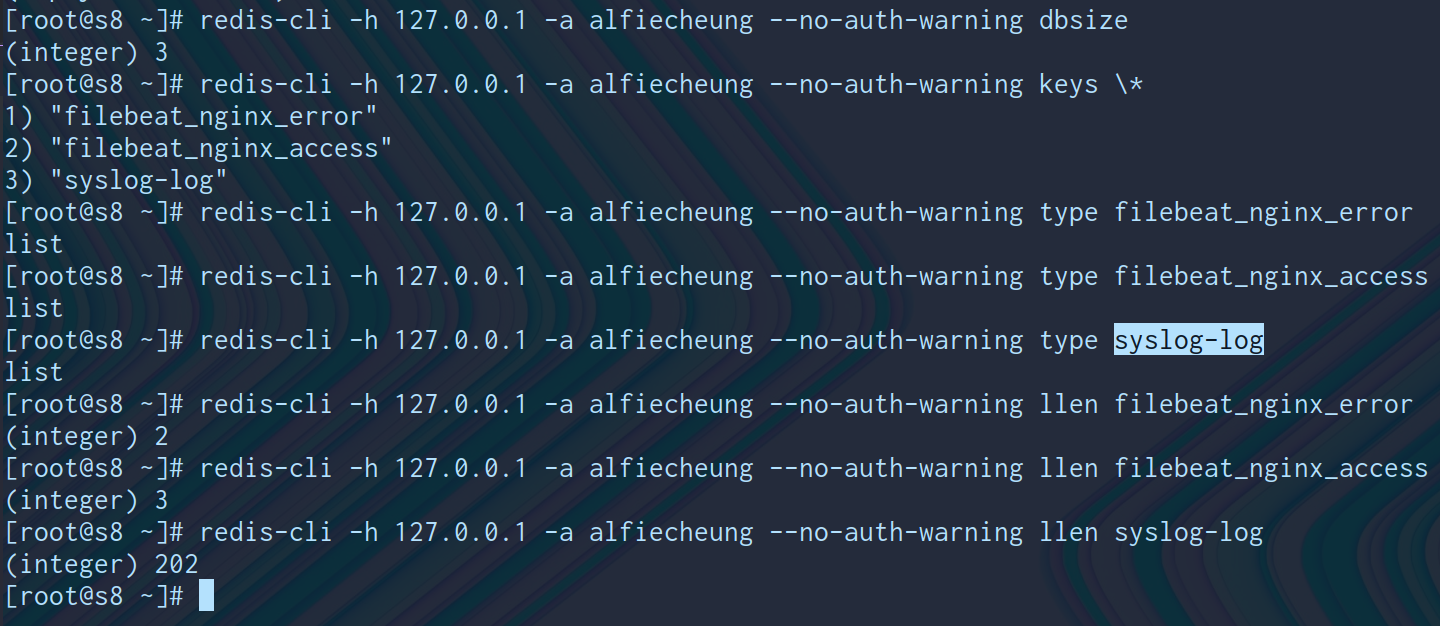
检查redis已有数据进入
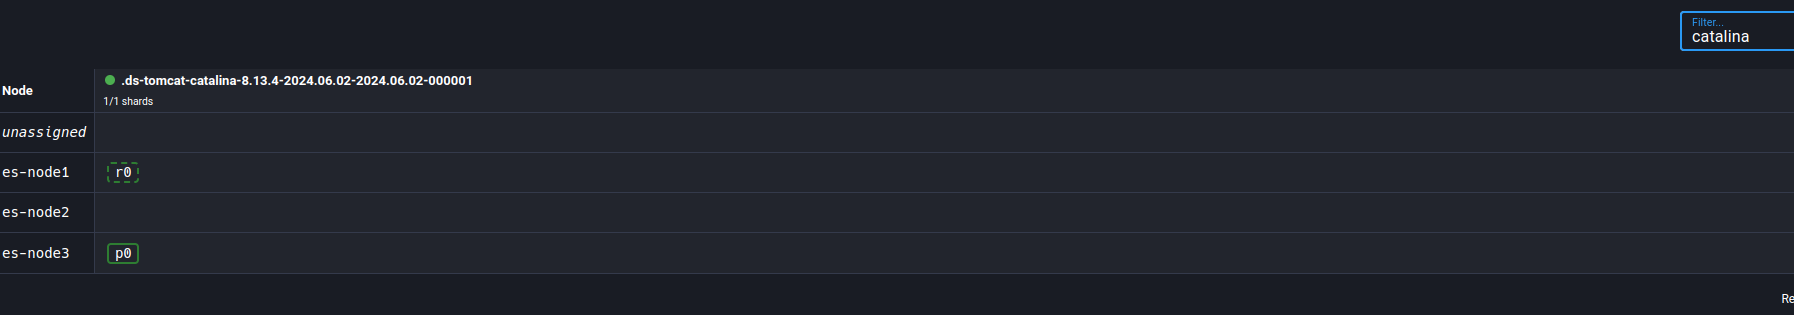
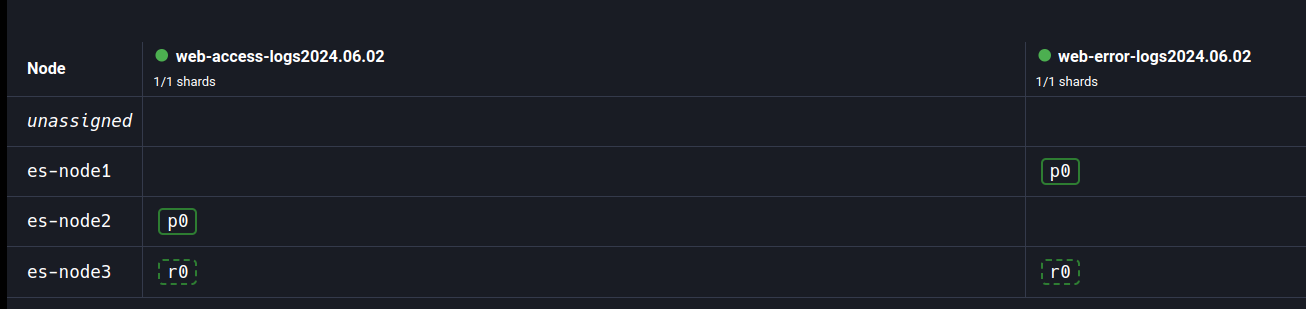
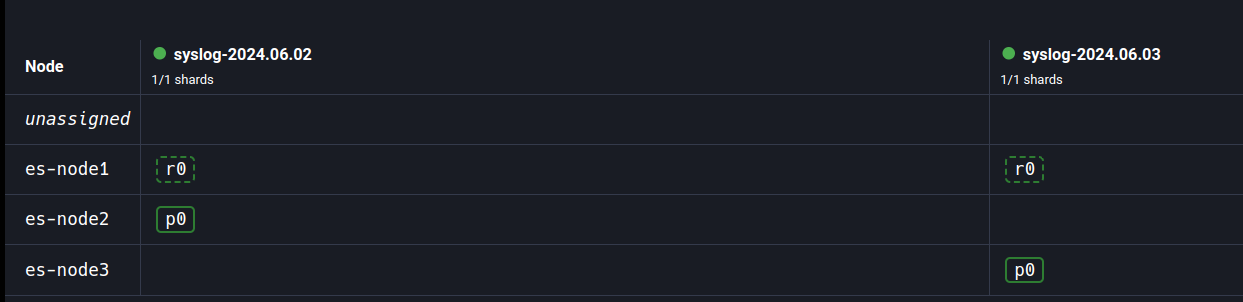
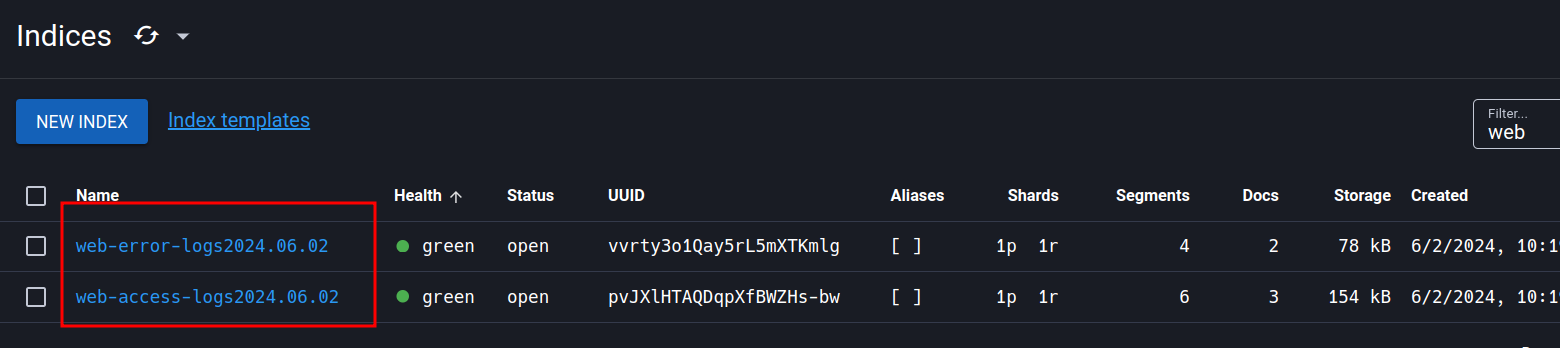
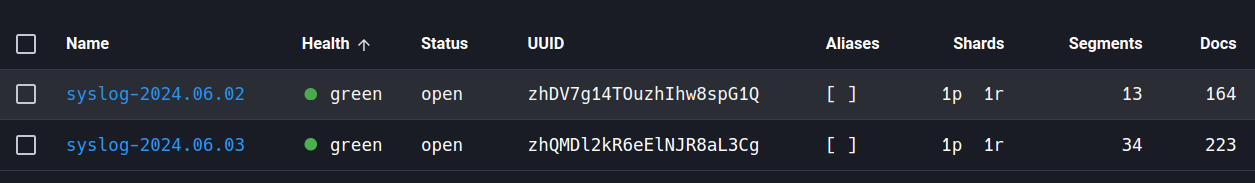
查看elasticesearch集群
shards
index
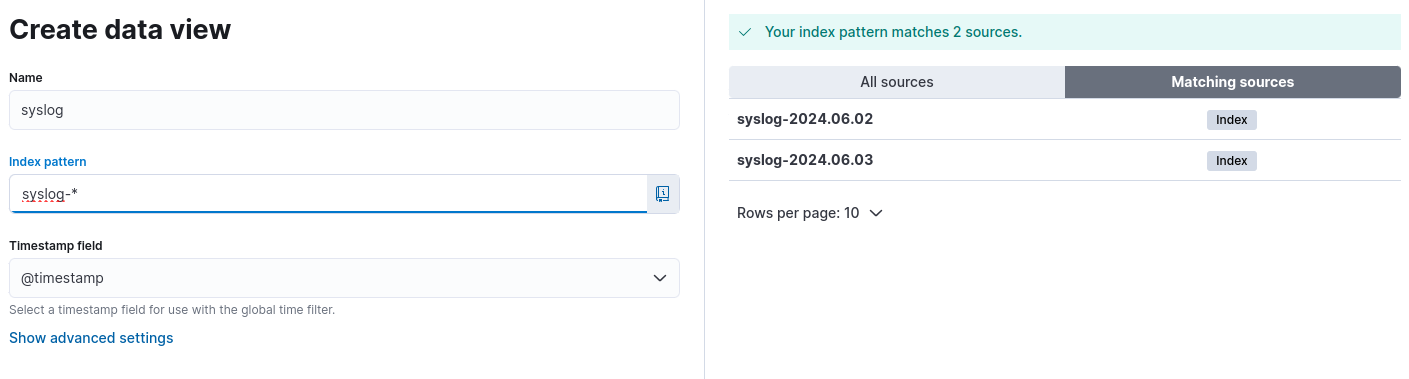
创建试图
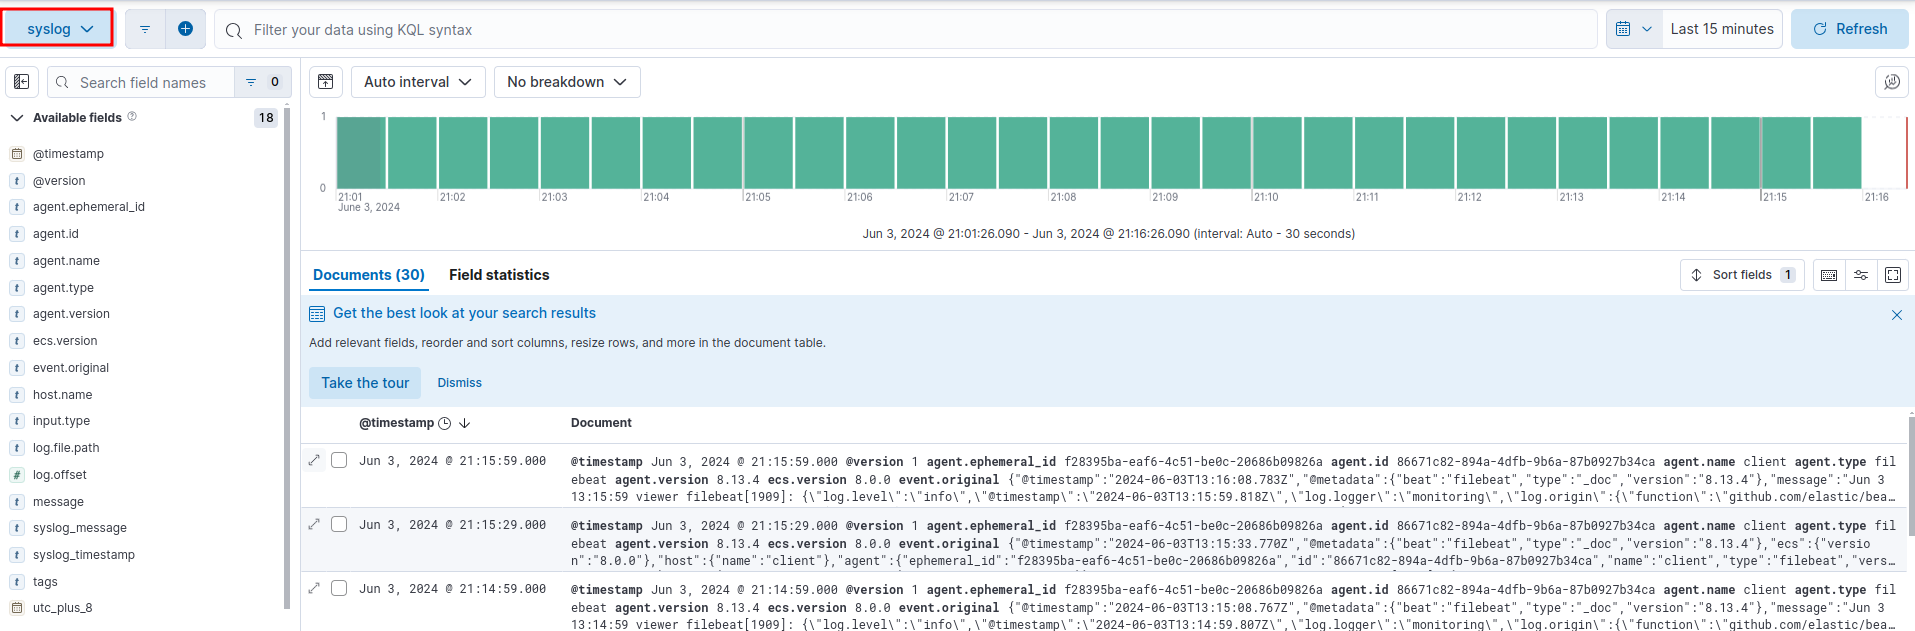
syslog
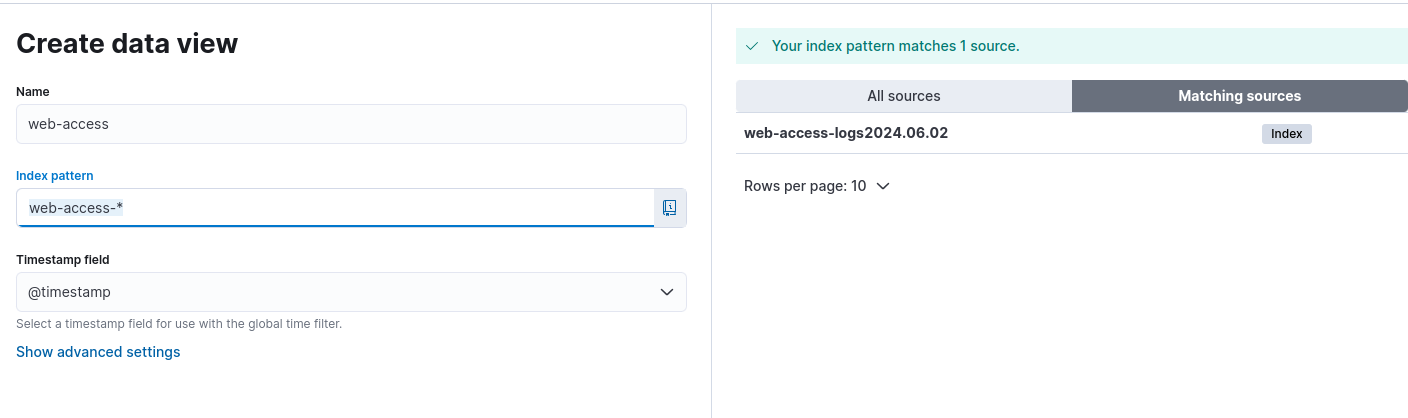
web-access
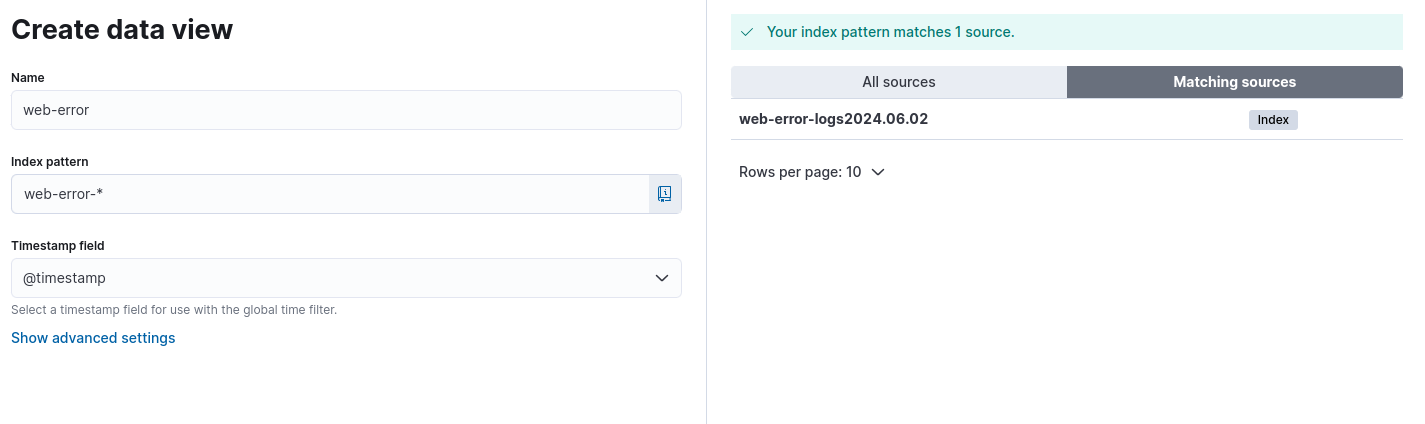
web-error
过滤日志
-
syslog
-
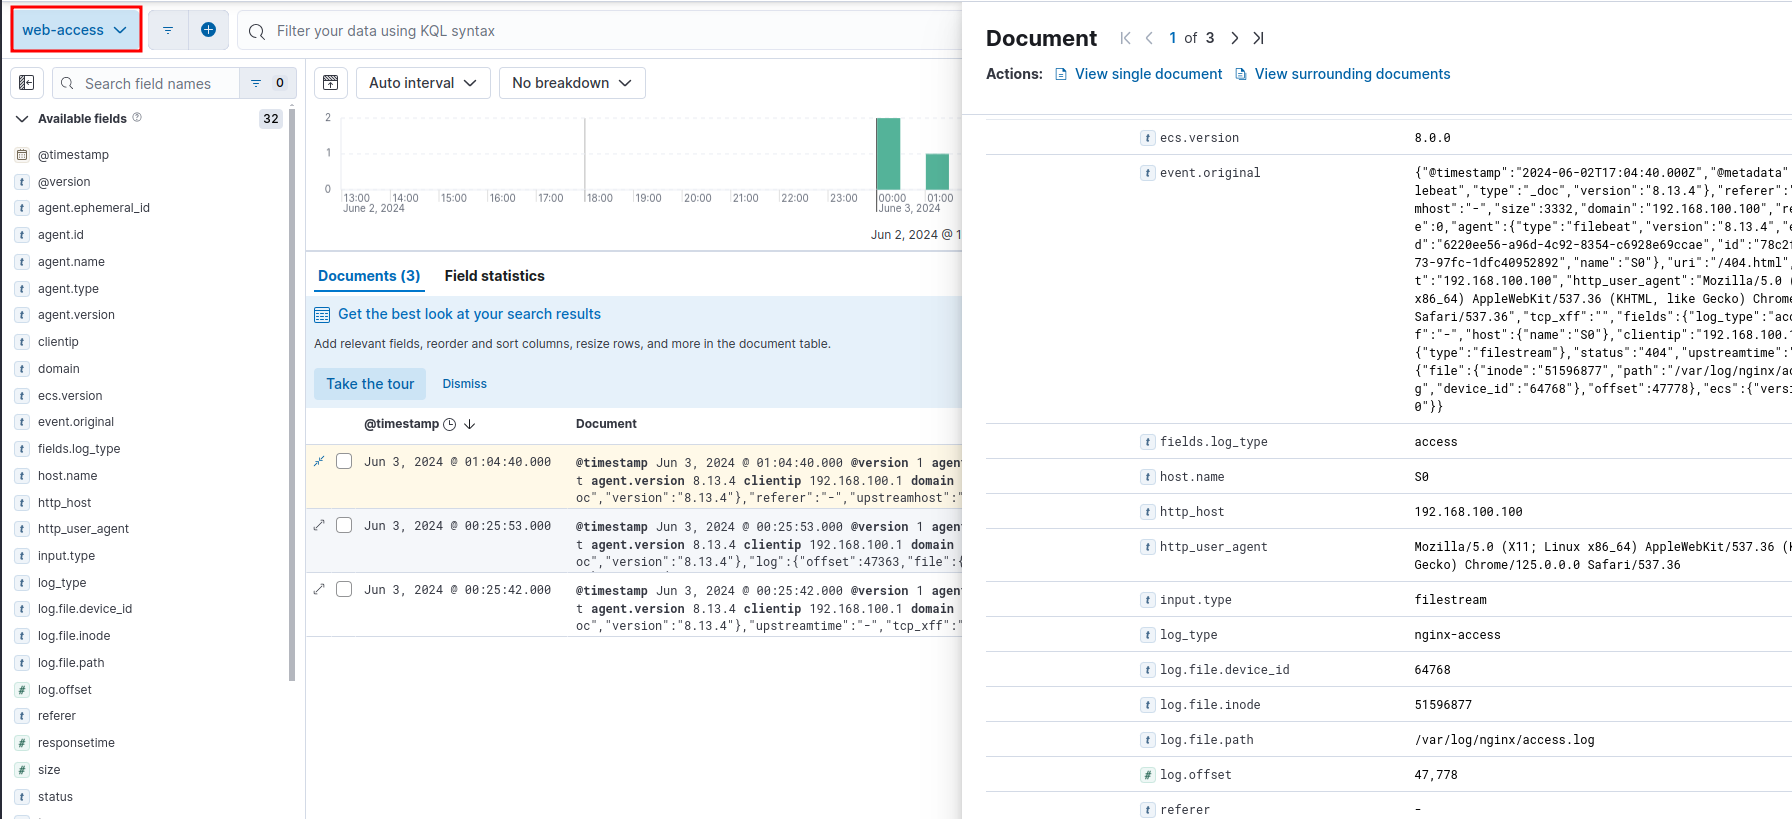
web-access
-
web-error
问题
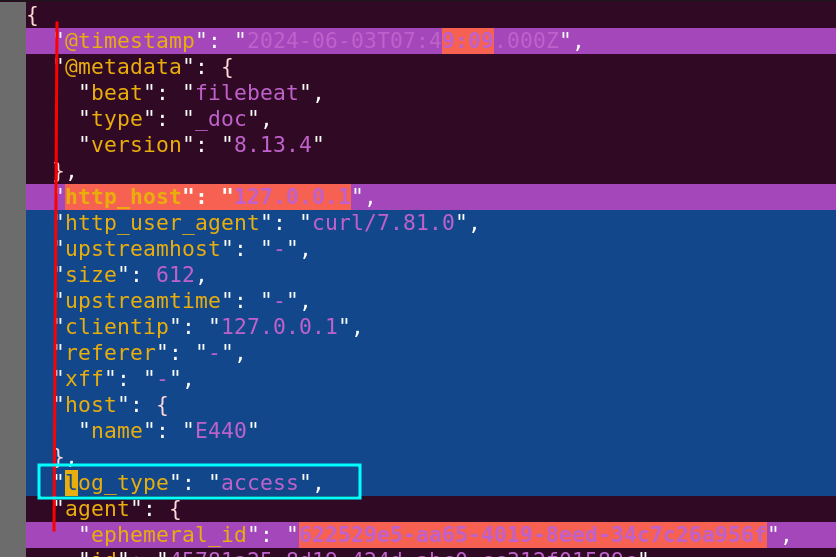
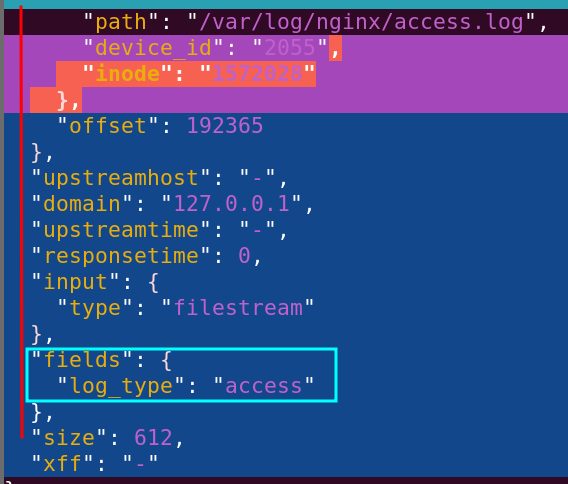
filebeat nginx日志被投递到默认的key未投送到指定key中
- 错误配置
filebeat.inputs:
  - type: filestream
  id: nginx-access-id
  enabled: true
  paths:
    - /var/log/nginx/access.log
  parsers:
    - ndjson:
        keys_under_root: true
        overwrite_keys: true
        add_error_key: true
  fields:
    log_type: "access"
  fields_under_root: true

- type: log
  id: nginx-error-id
  enabled: true
  paths:
    - /var/log/nginx/error.log
  fields:
    log_type: "error"
  fields_under_root: true

output.redis:
  hosts: ["127.0.0.1:6379"]
  password: "alfiecheung"
  db: 0
  timeout: 5
  key: "nginx-log"
  keys:
    - key: "filebeat_nginx_access"
      when.equals:
        fields.log_type: "access"
    - key: "filebeat_nginx_error"
      when.equals:
fields.log_type: "error"-
原因
- fields_under_root: true 配置会将
field字段置换到顶级 - 设置为
true - 设置为
false output字段使用了filed.log_type进行判断投递,因此出了乌龙
- fields_under_root: true 配置会将
-
解决方式
- 修改
fields_under_root: false
- 修改
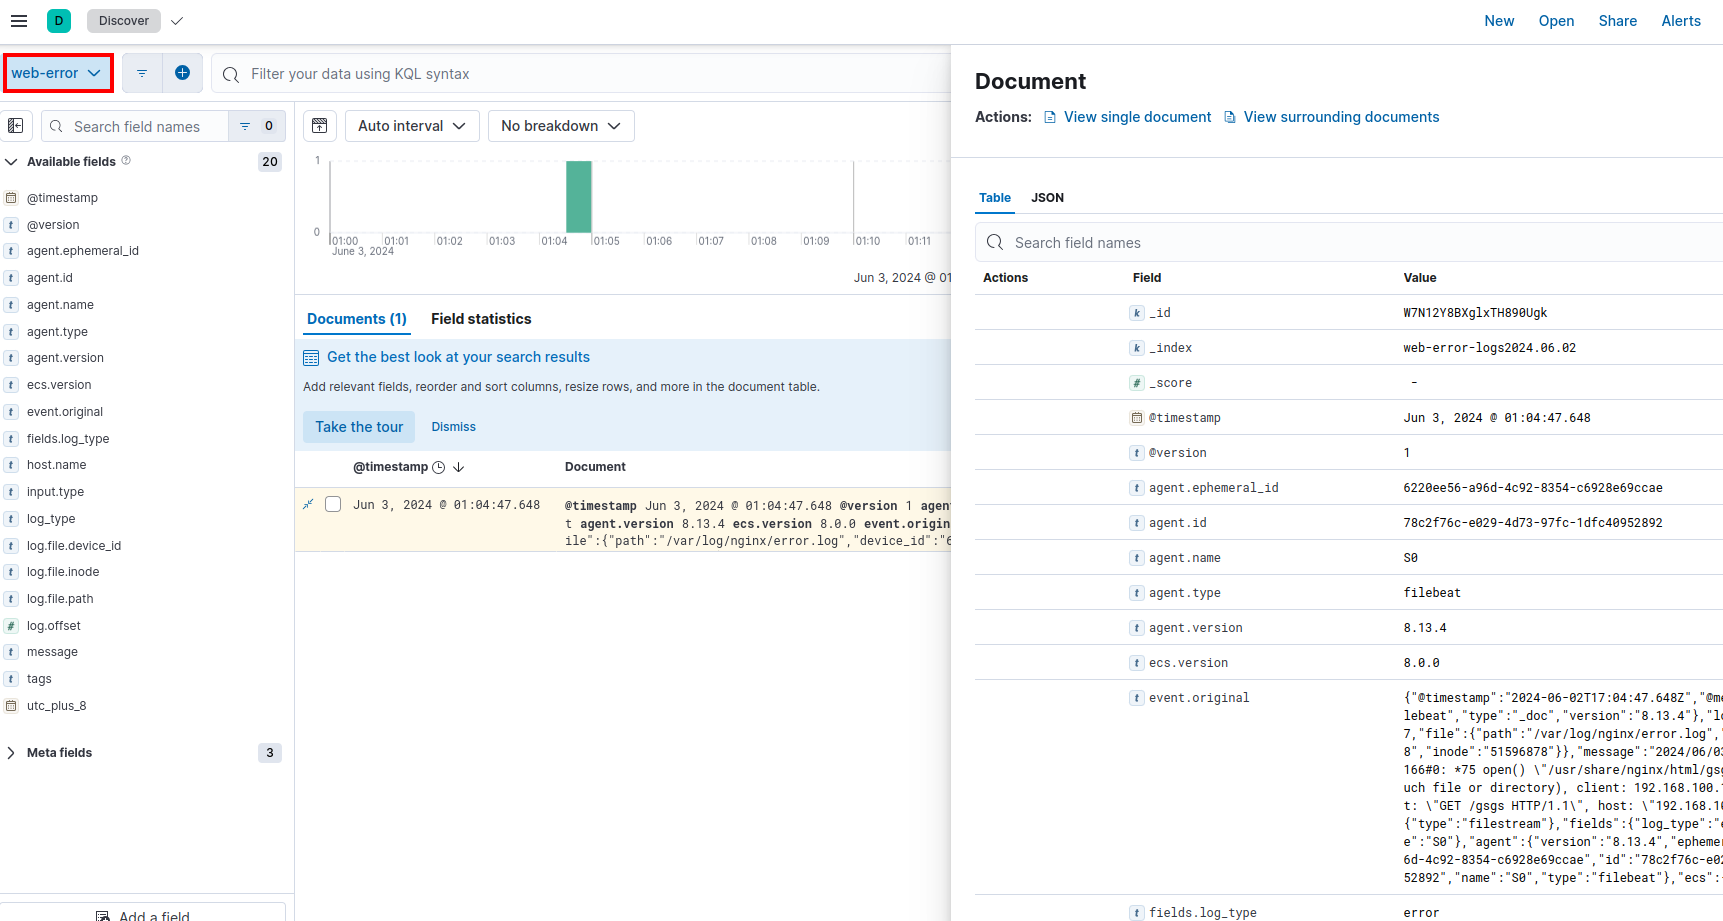
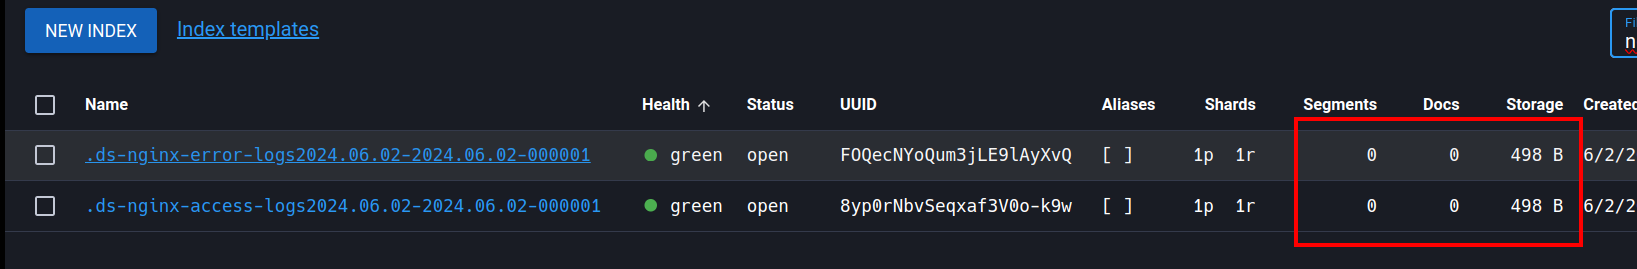
index 创建成功但没有数据
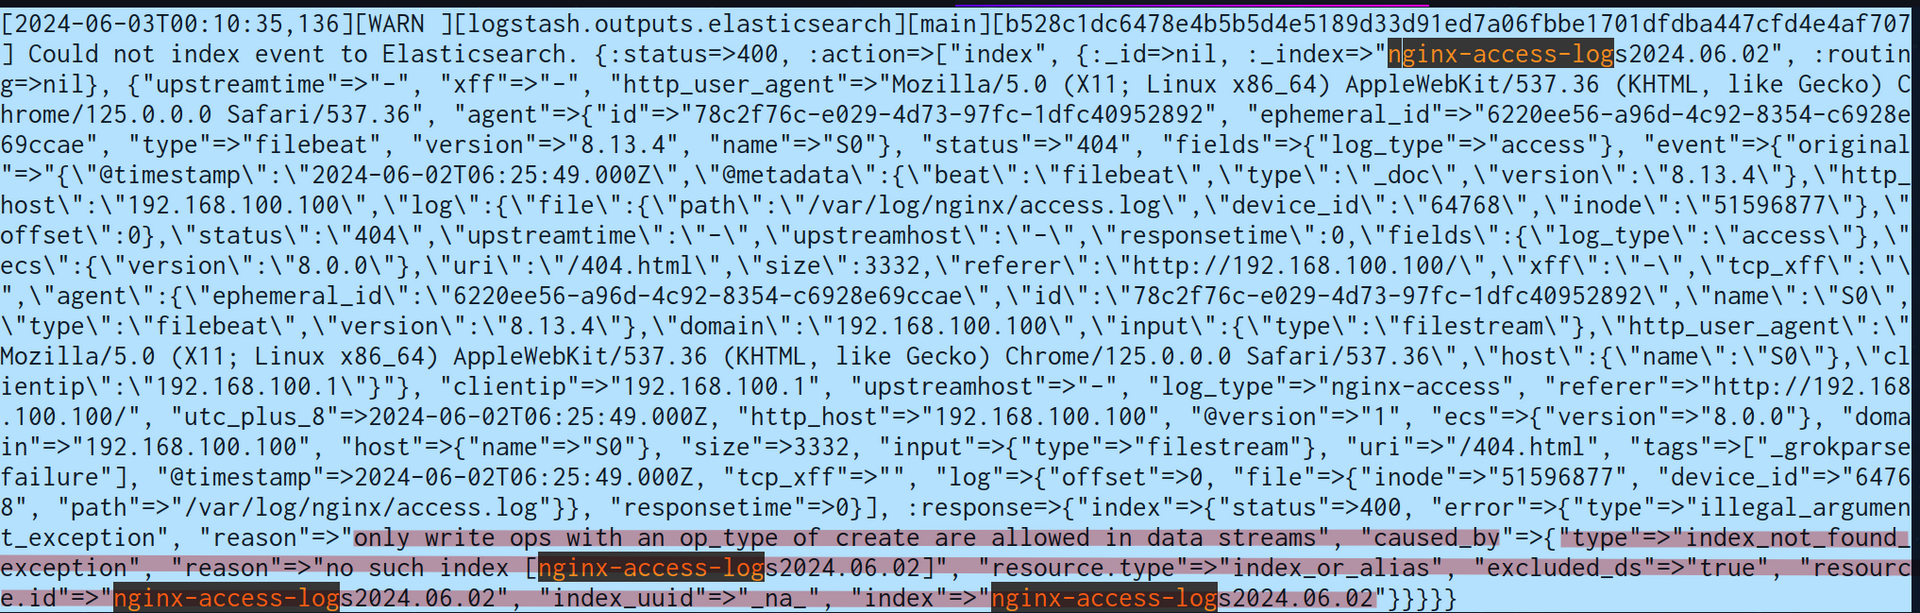
-
原因
- 此前实验过程在
filebeat进行了如下配置,这导致了对创建nginx开头的index都使用这个自定义index模板,而这里创建的是一个filebeat的datastream模板,使用需要采用data_stream关键字
... setup.ilm.enabled: false setup.template.name: "nginx" setup.template.pattern: "nginx-*"- 由于 index 设置为 nginx-access-logs%{+YYYY.MM.dd},写入的数据会匹配 Filebeat 配置中 setup.template.pattern: "nginx-*" 的模式,所以会应用 Filebeat 配置的 nginx 索引模板。
- 此前实验过程在
-
解决方式
- 采用
不同的 indeix 名称
- 采用